October 13, 2026
What is live fuel moisture, and why it moves your burn window
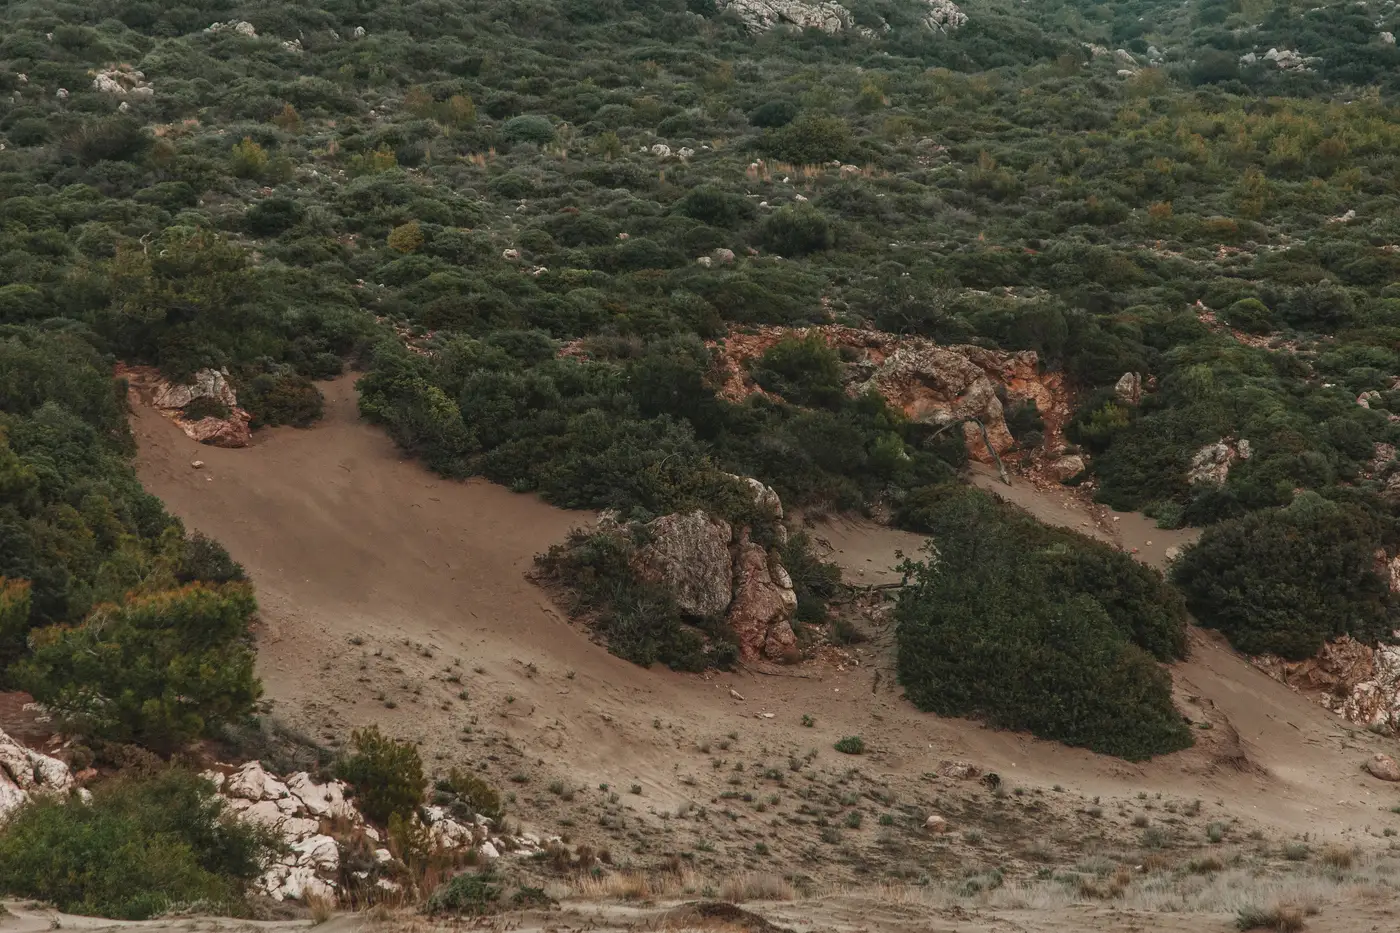
Live fuel moisture is the water content of living plant tissue, expressed as a percentage of the plant's oven-dry weight. A sprig of chamise at 150 percent live fuel moisture is carrying one and a half times its dry weight in water. The same sprig at 65 percent is carrying barely two-thirds. That difference is the whole story of why a brush unit that was unburnable in April can be a reasonable burn by September, or why a unit that looked ready last week gets pulled off the schedule after one hot, dry spell.
Dead fuel moisture gets more attention because it's easier to measure and reacts fast, sometimes within hours. Live fuel moisture is slower and it's biological, not just physical. A plant under drought stress, on a south-facing slope, or coming off a low-rain winter holds less water in its leaves and stems regardless of what the 10-hour fuels are doing that afternoon. For burn bosses working brush, chaparral, or mixed shrub units, live fuel moisture is often the number that decides whether fire will carry through the canopy or just creep along the duff.
How live fuel moisture is measured, and where that falls short
The standard method is still a field crew: clip live samples from representative plants, weigh them wet, oven-dry them, weigh again, and calculate percent moisture. Many agencies sample on a fixed schedule through fire season, often biweekly for species like chamise that have a well-documented seasonal moisture curve. That curve typically runs high in spring, well over 100 percent in new growth, and drifts down through summer as the plant hardens off and drought sets in, sometimes bottoming out in the 50s or 60s before fall rain resets it.
The gap is coverage. A sampling crew can realistically hit a handful of plots across a planning unit, and those plots are chosen because they're accessible, not because they're the driest aspect or the most drought-stressed stand on the landscape. A burn prescription written against one or two sample sites assumes the rest of the unit tracks the same curve. On uniform, well-studied brush fields that assumption mostly holds. On a mixed unit with south slopes, past dieback, and patches that never fully recovered from a dry decade, it doesn't, and the crew usually finds out the hard way, either with fire that won't carry where the prescription expected it to or fire that runs harder than planned in a pocket nobody sampled.
Why this shifts the burn window itself
A burn window is a stack of thresholds: wind, relative humidity, dead fuel moisture by timelag class, and live fuel moisture for whatever brush species dominates the unit. Live fuel moisture is usually the slowest-moving of those and the one most tied to the broader drought picture rather than the day's weather. That's why a prescription can open on paper, winds right, humidity right, dead fuels right, and still get held because the live fuel sample came back 15 points wetter than the burn plan calls for. It's also why a window that looked closed for the season can crack open after an unusually dry stretch pushes live fuel moisture down faster than the calendar suggested it would.
That seasonal drift is exactly where a planning unit's canopy condition and dryness pattern matter as much as the single sample point. Knowing which parts of a unit are running drier than the rest, year over year, changes where a fuel break actually needs to go and which blocks are worth prioritizing while the window is open. That's the gap Fuel Load Mapping is built to close, mapping canopy structure and dryness across the whole planning unit annually rather than relying on a few field plots to stand in for conditions everywhere.
Live fuel moisture will keep being a field measurement, and it should be. But a unit-wide picture of where the dry pockets sit each year gives that one number somewhere to live. If that's missing from your current burn planning, it's worth a look at what an annual fuel-class layer adds.