October 19, 2026
Field notes: the ridge that burned hotter than the fuel map said it would
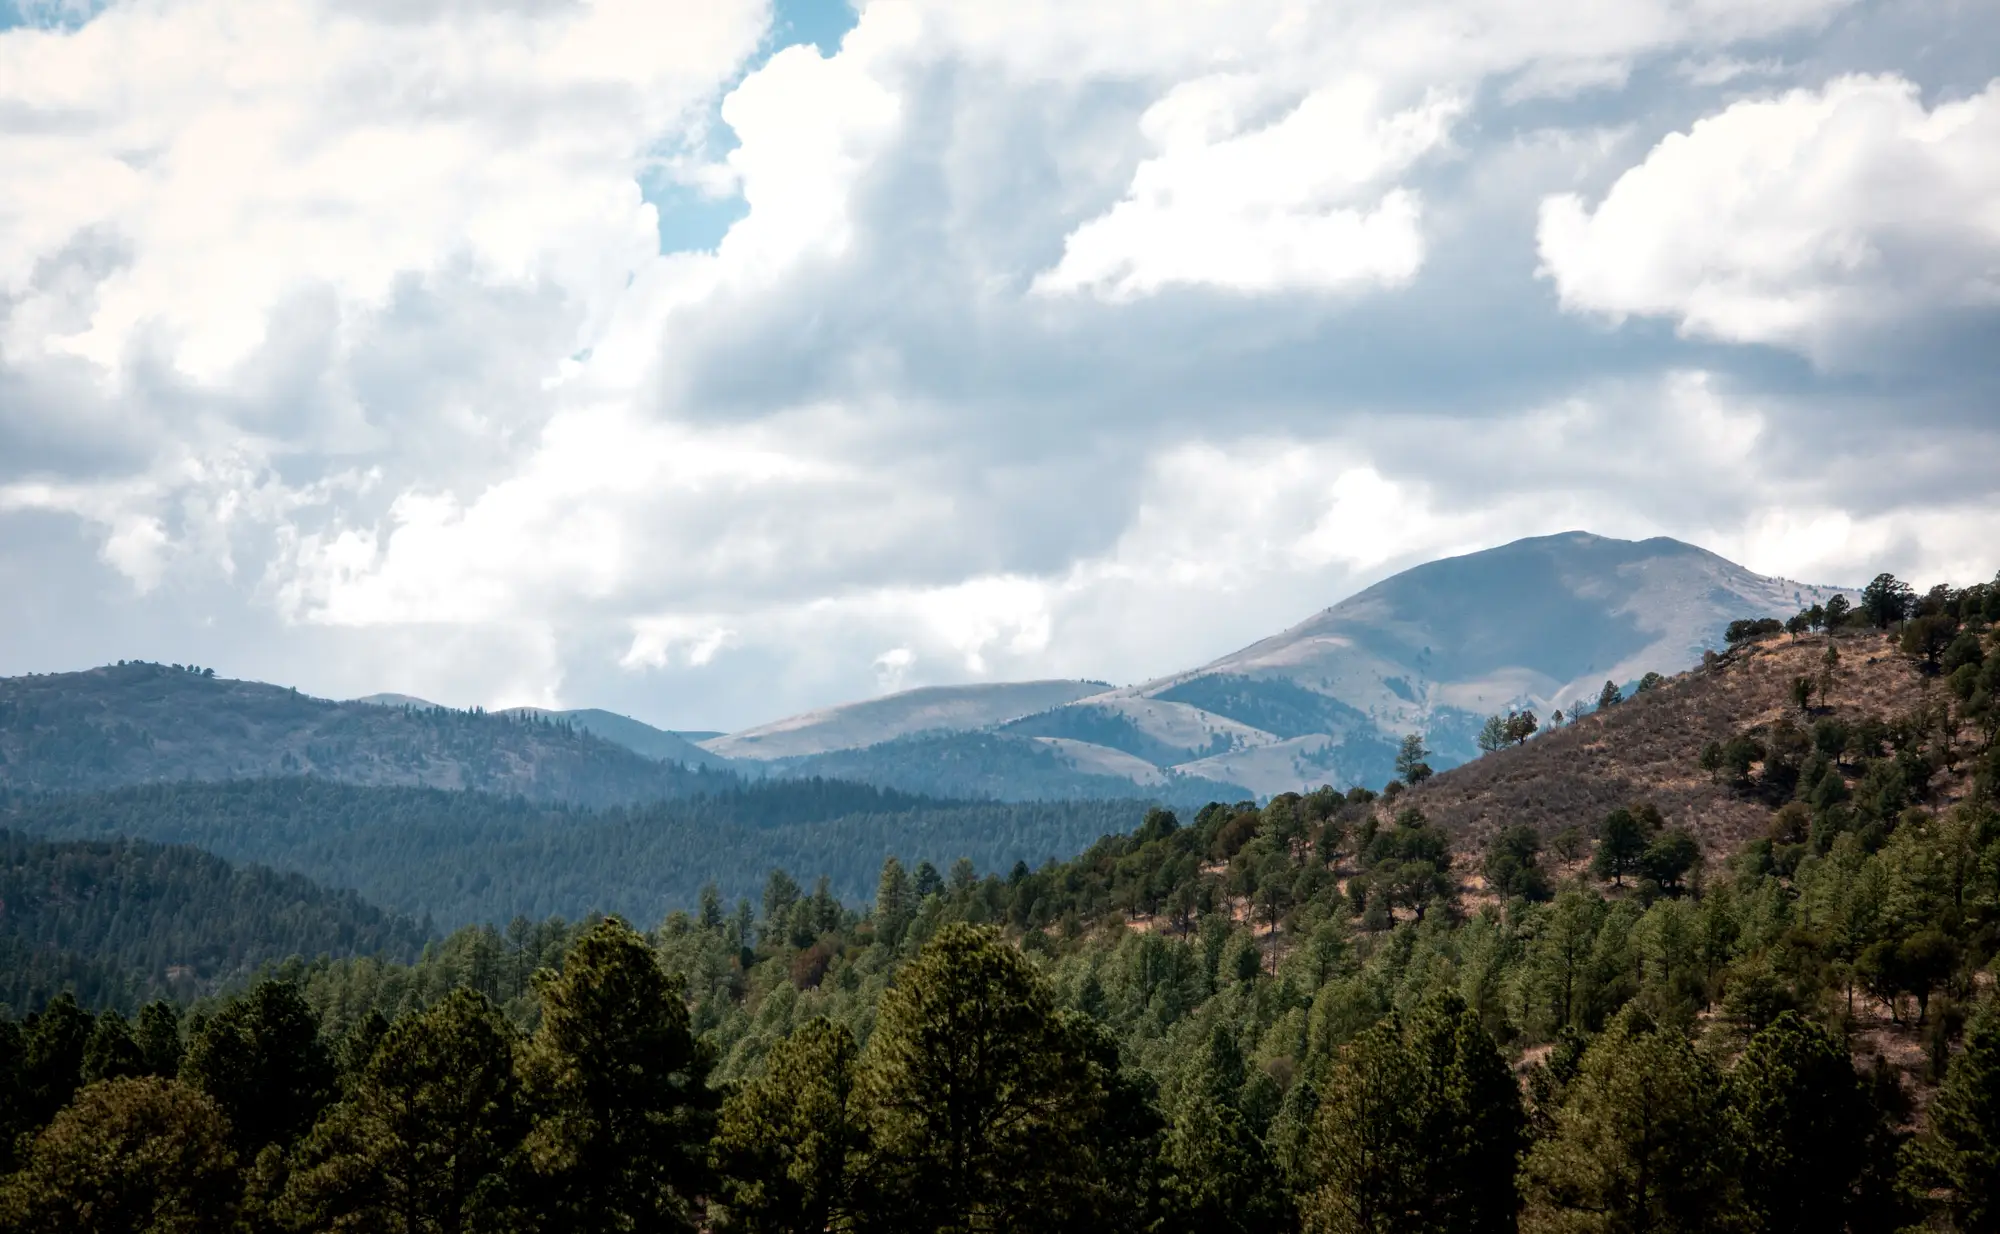
The fuel map called it a Fuel Model 9, timber litter, moderate rate of spread. Anybody who'd walked that ridge in the last three years could have told you it wasn't a 9 anymore. It burned like an 11, maybe worse, torching through pockets that should have crept along the duff layer and self-extinguished at the rockier benches.
This is the kind of thing that gets talked about around the truck tailgate more than it gets written up anywhere official: a unit where the fire behaved like the fuels were a decade younger and a lot drier than the map on the dash said they were. Because the map was a decade old. It was built off a vegetation layer that predated two bark beetle pushes, a wind-throw event nobody flew a transect over, and about six years of a hotter, drier shoulder season than whoever drew the polygon had in mind.
Aged fuel maps don't fail all at once. They fail in patches. A planning unit might be 80 percent still accurate to the field, which is exactly the problem, because that 20 percent is rarely distributed evenly.
It clusters on the slopes that took a beetle hit and never got re-flown, the strip where a windstorm laid timber flat, the unit where regen came in thick after a prior burn. Those are also, not coincidentally, the places where fire behavior analysts get surprised. The flat ground that never changes doesn't bite anybody. The ridge does.
What actually happened on that ridge, best anyone could reconstruct after the fact, was a canopy structure problem dressed up as a fuel loading problem. The overstory had thinned from beetle kill enough to let more sun and wind into the understory, which dried out the surface fuels faster than the regional fuel model assumed, and it let a decent crop of regen and dead standing material build up under a canopy that the map still treated as closed and shading. The fuel model on paper was describing a forest that didn't exist anymore. The forest on the ground had thinned, dried, and filled in with regen while the label sat untouched since the last full inventory.
Field crews catch some of this. A good fuels tech walking a transect will flag a stand that doesn't match its label. But transects sample points, not ridgelines, and a planning unit might run to tens of thousands of acres with crew-days to cover a fraction of it in a season. The map gets updated where someone happened to walk, and the rest ages in place until the next big disturbance event forces a rewrite, usually after a fire has already made the point for everybody.
The thing worth sitting with isn't that fuel maps go stale. Everybody who's worked a desk long enough already knows that. It's how much of the staleness tracks canopy change specifically, not just surface fuel accumulation, and how little of the standard mapping cycle is built to catch a canopy thinning or filling in under a label that hasn't been touched since the last full inventory. A fuel model built on five-year-old canopy cover numbers is describing shade, moisture retention, and wind exposure that may no longer be there, which means the rate-of-spread assumption baked into that model is wrong before anyone strikes a match.
That's the gap we built Fuel Load Mapping to close. The approach pulls current canopy structure and dryness conditions from high-resolution imagery and runs them against standard fuel model classes every year, so the polygon for that ridge reflects what the beetle kill and the regen did to it this season, not what a field crew logged five summers back. If you're siting a fuel break or scoping a burn unit and you'd rather trust this year's canopy than an inventory that predates the last disturbance, take a look at what an annual fuel-load layer built from imagery can do for your planning unit.